Load the R package we will use.
What is the average age of members that have served in congress?
Set random seed generator to 123
Take a sample of 100 from the dataset congress_age and assign it to congress_age_100
Construct the confidence interval
1. Use specify to indicate the variable from congress_age_100 that you are interested in
Response: age (numeric)
# A tibble: 100 x 1
     age
   <dbl>
 1  53.1
 2  54.9
 3  65.3
 4  60.1
 5  43.8
 6  57.9
 7  55.3
 8  46
 9  42.1
10  37
# … with 90 more rows
2. generate 1000 replicates of your sample of 100
Response: age (numeric)
# A tibble: 100,000 x 2
# Groups:   replicate [1,000]
   replicate   age
       <int> <dbl>
 1         1  42.1
 2         1  71.2
 3         1  45.6
 4         1  39.6
 5         1  56.8
 6         1  71.6
 7         1  60.5
 8         1  56.4
 9         1  43.3
10         1  53.1
# … with 99,990 more rows
The output has 100,00 rows
3. calculate the mean for each replicate
Assign to bootstrap_distribution_mean_age
Display bootstrap_distribution_mean_age
# A tibble: 1,000 x 2
   replicate  stat
 *     <int> <dbl>
 1         1  53.6
 2         2  53.2
 3         3  52.8
 4         4  51.5
 5         5  53.0
 6         6  54.2
 7         7  52.0
 8         8  52.8
 9         9  53.8
10        10  52.4
# … with 990 more rows
The bootstrap_distribution_mean_age has 1000 means
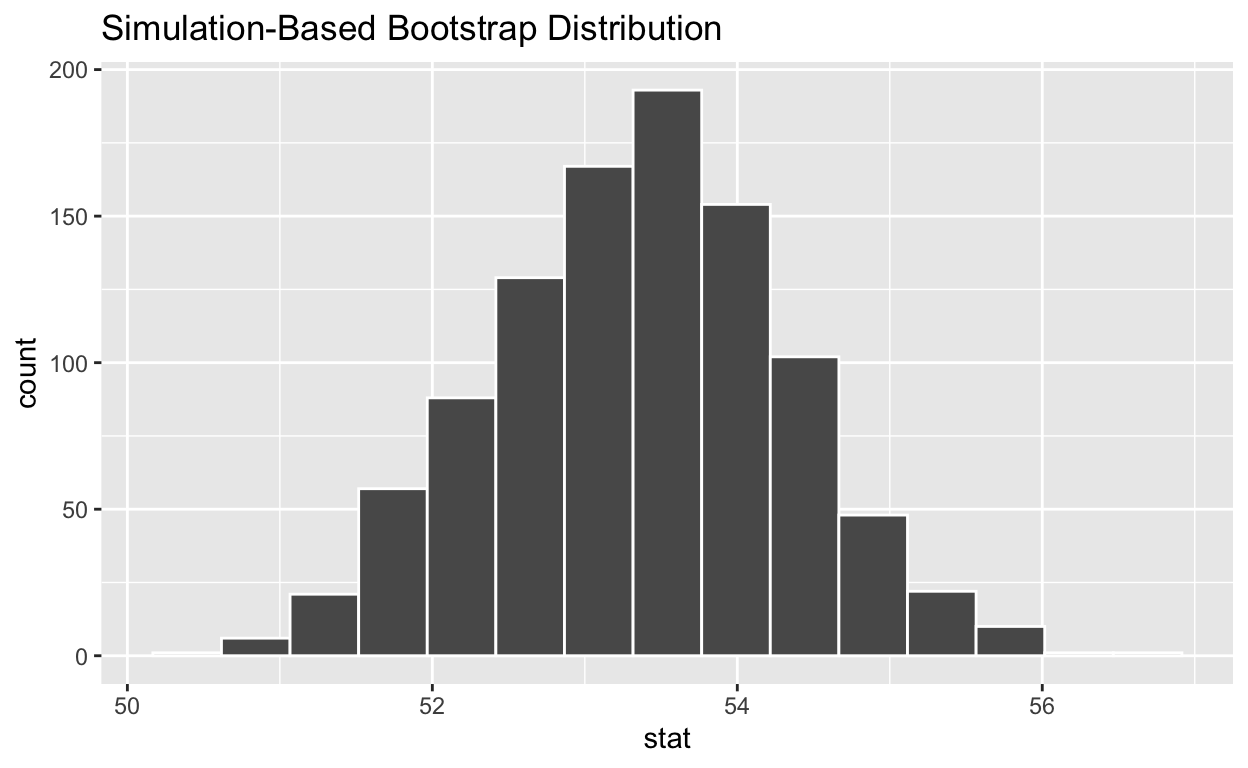
4. visualize the bootstrap distribution
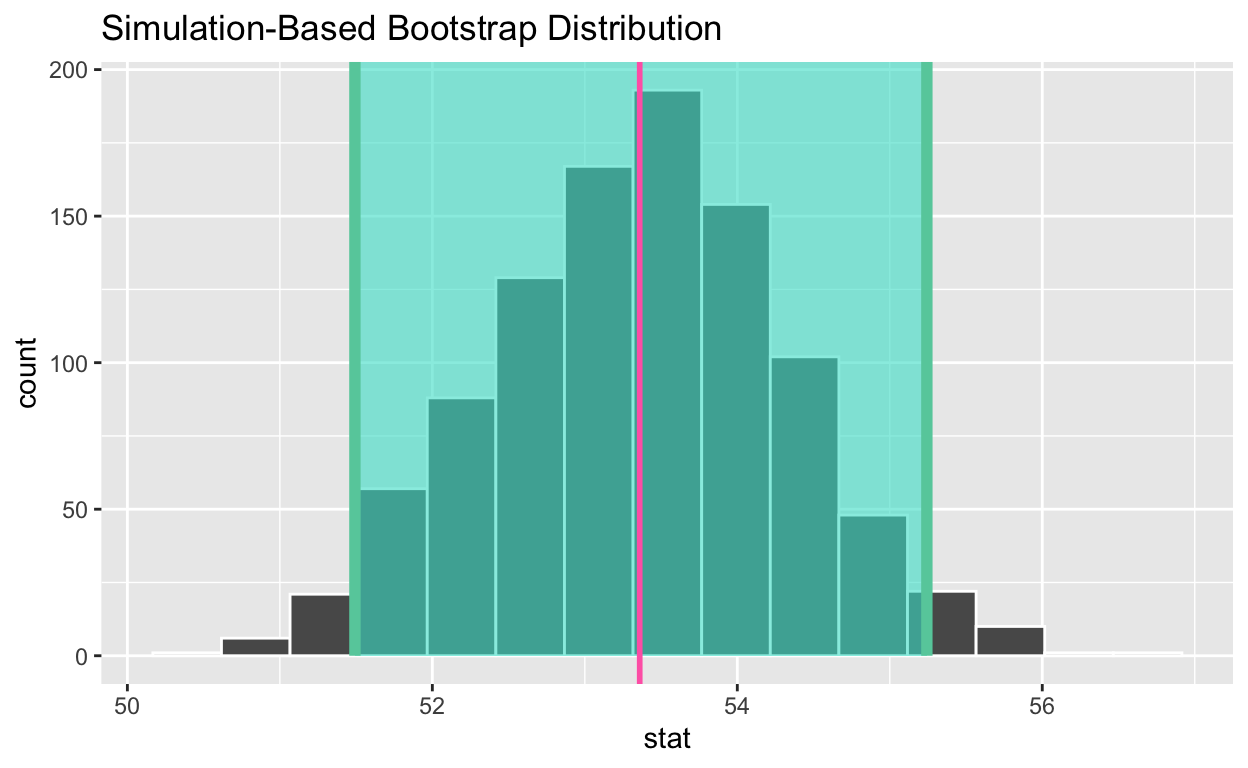
Calculate the 95% confidence interval using the percentile method
Assign the output to congress_ci_percentile
Display congress_ci_percentile
# A tibble: 1 x 2
  lower_ci upper_ci
     <dbl>    <dbl>
1     51.5     55.2
Calculate the observed point estimate of the mean and assign it to obs_mean_age
- Display obs_mean_age,
[1] 53.36Shade the confidence interval
Add a line at the observed mean, obs_mean_age, to your visualization and color it “hotpink”
Calculate the population mean to see if it is in the 95% confidence interval
Assign the output to pop_mean_age
Display pop_mean_age
[1] 53.31373- Add a line to the visualization at the, population mean, pop_mean_age, to the plot color it “purple”
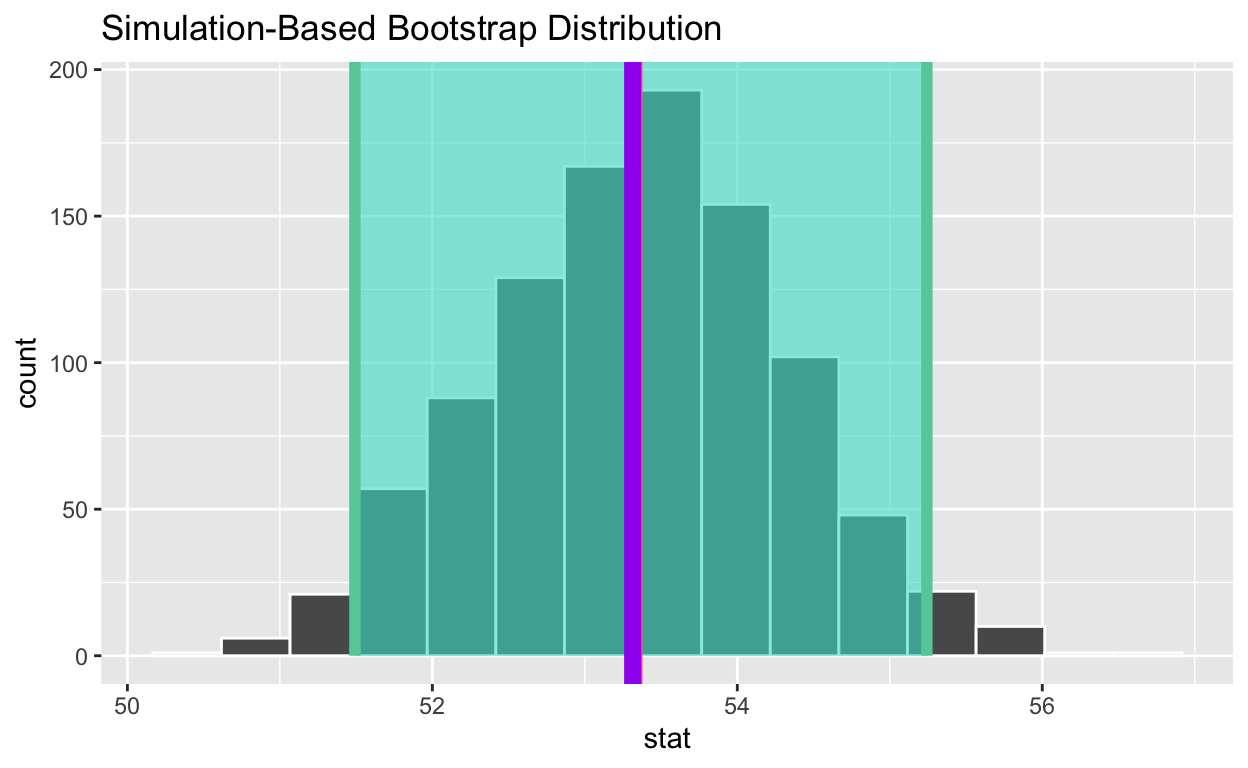
Is population mean the 95% confidence interval constructed using the bootstrap distribution? YES
Change set.seed(123) to set.seed(4346). Rerun all the code.
When you change the seed is the population mean in the 95% confidence interval constructed using the bootstrap distribution? ???
If you construct 100 95% confidence intervals approximately how many do you expect will contain the population mean? ???